
Arbitrum Price Prediction 2024 – 2033: ARB breaks key barrier
13d ago•

bullish:
0
bearish:
0
Share
Key takeaways
- Arbitrum is range bound with resistance levels at $1.1.
- Our ARB predictions anticipate a high of $1.83 by the end of 2024.
- In 2030, it will range between $15.64 and $19.15.
Layer 2s have made quite a buzz over the last few months because of their high network activity. Arbitrum led the pack with a total value locked (TVL) of $16.24 billion. Arbitrum is an Optimistic Rollup solution that shifts network operations away from the Ethereum mainnet while maintaining Ethereum-level security.
Arbitrum’s Bold testnet also went live; when integrated into the main net, the update will enable permissionless validation on Arbitrum. This means that anyone can challenge the state of the Arbitrum network. Currently, validators are allow-listed, but with BOLD, that will no longer be possible.
Is Arbitrum a good investment? Will ARB ever go up? Where will ARB be in 5 years? Let’s answer them using our Arbitrum price prediction.
Overview
| Cryptocurrency | Arbitrum |
| Token | ARB |
| Current Price | $1.05 |
| Market Cap | $2,653,939,384 |
| Trading Volume | $193,956,214 |
| Circulating Supply | 2,653,939,384 |
| All-time High | $2.40, on January 2024 |
| All-time Low | $0.7453, on September 2023 |
| 24-hour High | $1.0634 |
| 24-hour Low | $1.0346 |
Arbitrum Price Prediction: Technical Analysis
| 30-day Price Prediction | $1.45 |
| Volatility (30-day variation) | 13.84% |
| 50-Day SMA | $1.3999 |
| 14-Day RSI | 35.87 |
| Sentiment | Bearish |
| Fear & Greed Index | 69 (Greed) |
| Green Days | 11/30 (37%) |
| 200-Day SMA | $1.4587 |
Arbitrum price analysis: ARB seeks breakout levels
TL; DR Breakdown
- ARB has stagnated over the last 19 days.
- Little market momentum to sustain a breakout in the short term from the current price.
- The moving averages point to a negative breakout.
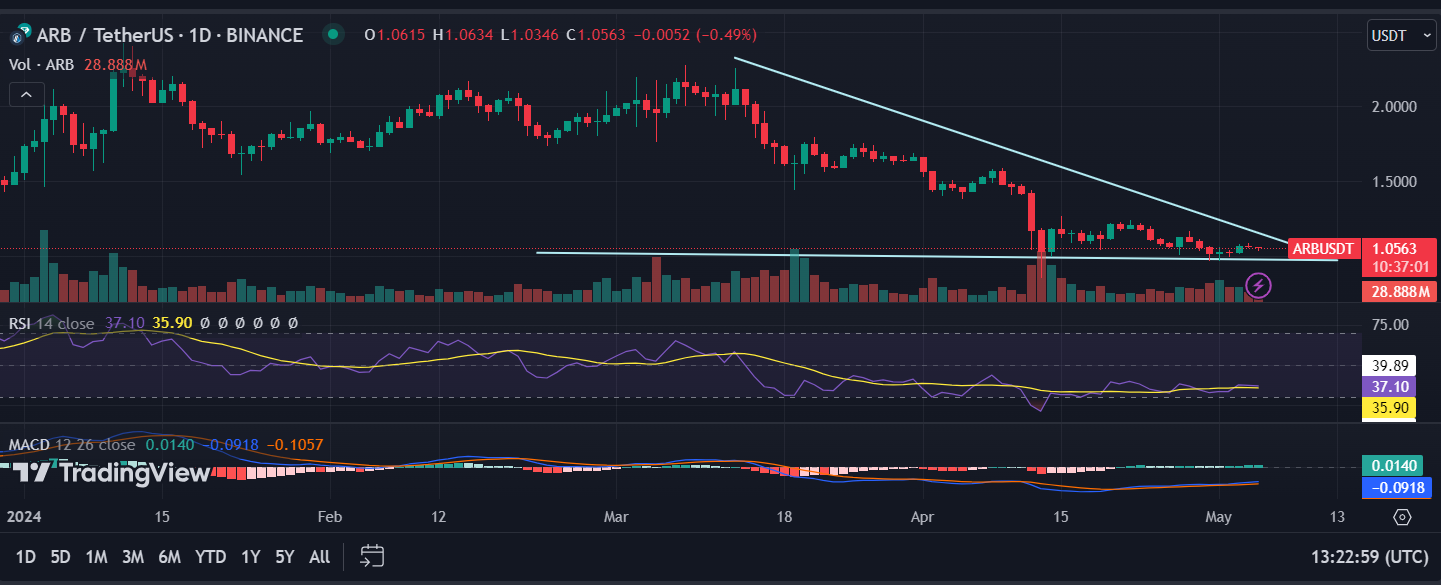
ARB price analysis 1-day chart: ARB stagnates for 19 consecutive days
Arbitrum is moving sideways, a move that began on April 14, following a sell-off that saw the coin lose half its value in 30 days. The state of consolidation is supported by the neutral Relative Strength Index at 35.87, neutral average directional index, and little price momentum.
Long periods of consolidation are accompanied by more extended breakouts. The moving averages indicate it is still bearish and best to sell in the current areas. Will ARB breakout lower?
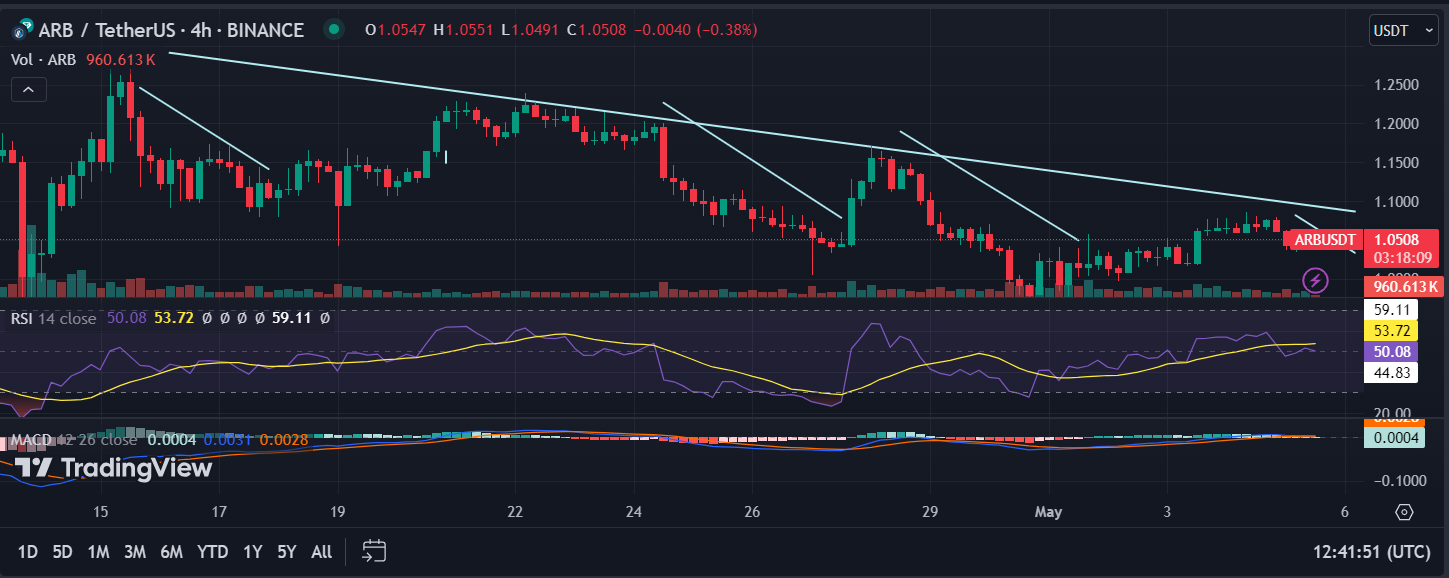
ARB/ USD 4-hour price chart: Resistance at the $1.1 mark
On the shorter timeframe, ARB registers lower highs after every bullish breakout. If the trend holds, the coin faces resistance at the $1.1 mark and will drop lower from current levels.
Arbitrum Technical Indicators: Levels And Action
Daily Simple Moving Average (SMA)
| Period | Value ($) | Action |
| SMA 3 | 1.1048 | SELL |
| SMA 5 | 1.0505 | SELL |
| SMA 10 | 1.1473 | SELL |
| SMA 21 | 1.1642 | SELL |
| SMA 50 | 1.3999 | SELL |
| SMA 100 | 1.6707 | SELL |
| SMA 200 | 1.4587 | SELL |
Daily Exponential Moving Average (EMA)
| Period | Value | Action |
| EMA 3 | 1.1090 | SELL |
| EMA 5 | 1.1391 | SELL |
| EMA 10 | 1.2184 | SELL |
| EMA 21 | 1.3567 | SELL |
| EMA 50 | 1.5553 | SELL |
| EMA 100 | 1.6153 | SELL |
| EMA 200 | 1.5198 | SELL |
| Weekly Simple Moving Average (SMA) | ||
| Period | Value ($) | Action |
| SMA 21 | 0.6524 | BUY |
| SMA 50 | 0.0238 | BUY |
| Weekly Exponential Moving Average (EMA) | ||
| Period | Value ($) | Action |
| EMA 21 | 1.5204 | SELL |
| EMA 50 | 0.4142 | BUY |
What can you expect from Arbitrum price analysis next?
The moving averages are bearish on ARB, and the current analysis indicates negative momentum. At current levels, the coin has little momentum to make a substantial break from current levels. Over the short term, it will remain rangebound but bearish over the long term. A reversal should suffice when the daily RSI breaks below 30.
Recent News/ Update
Gaming ecosystems are quickly adopting the Arbitrum Chain for its efficiency. The latest inclusions include King of Destiny, Variance, and Arbitrum Arcade.
Arbitrum Price Prediction May 2024
Arbitrum could break out lower from current levels. A break below 30 RSI will necessitate a steep reversal. This month, ARB will trade between $0.85 and $1.20. With an average of $1.04.
| Arbitrum Price Prediction | Potential Low ($) | Average Price ($) | Potential Low ($) |
| Arbitrum Price Prediction May 2024 | $0.85 | $1.04 | $1.20 |
Arbitrum Price Prediction 2024
The benefits of Ethereum ‘blobs’ upgrade this year quickly trickle down to the Layer 2 blockchains. The upgrade enables the L2s to reduce transaction costs for data posted on Ethereum.
As the second half of 2024 unfolds, ARB’s development track continues to provide more value to its users. ARB is bearish; however, we anticipate it will trade between $0.85 and $1.70 over the second half of 2024.
| Year | Potential Low ($) | Average Price ($) | Potential High ($) |
| 2024 | $0.85 | $1.45 | $1.70 |
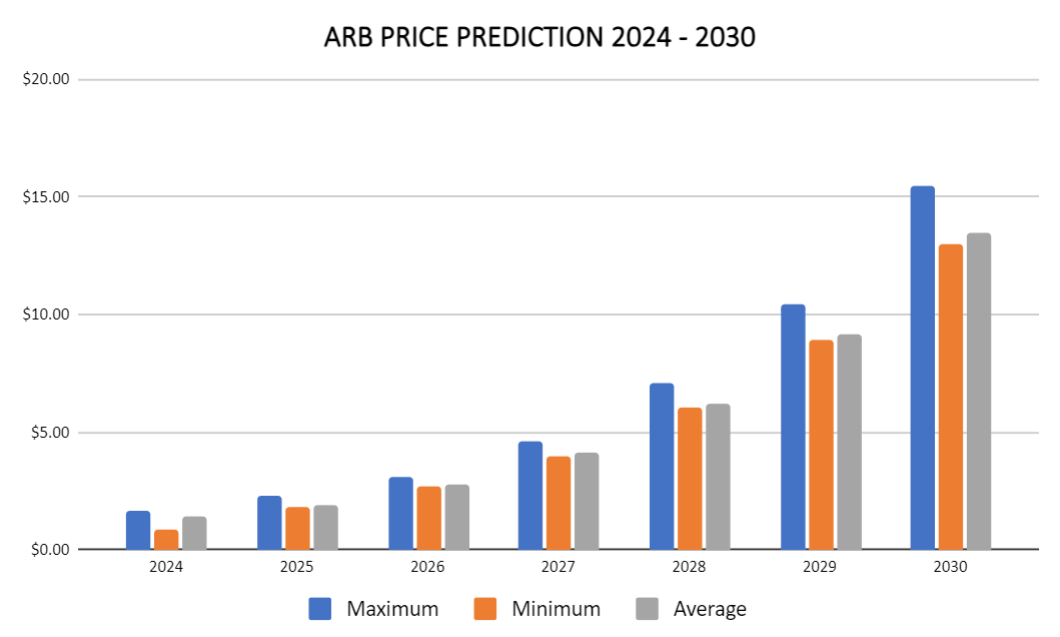
Arbitrum Price Predictions 2025 – 2030
| Year | Potential Low ($) | Average Price ($) | Potential High ($) |
| 2025 | 1.84 | 1.90 | 2.28 |
| 2026 | 2.66 | 2.74 | 3.10 |
| 2027 | 3.96 | 4.10 | 4.60 |
| 2028 | 6.02 | 6.19 | 7.05 |
| 2029 | 8.92 | 9.17 | 10.43 |
| 2030 | 12.99 | 13.45 | 15.43 |
Arbitrum Price Prediction 2025
The Arbitrum Foundation community is quickly driving more utility into the Arbitrum ecosystem. Projects such as the stage 2 rollup BOLD will have gone mainnet, enabling permissionless validation on Arbitrum. We anticipate more growth in 2025.
Arbitrum price forecast for 2025 sets the high at $2.28. However, in case of a market correction from the post-Bitcoin halving, the ARB price might rest at $1.84, making an average of $1.90.
Arbitrum Price Prediction 2026
The year 2026 will experience more bullish momentum. As per the Arbitrum ARB price prediction, it will range between $2.66 and $3.10, with an average trading price of $2.74.
The growth might result from expanding the Arbitrum community as it draws more users.
Arbitrum Price Prediction 2027
Moving into 2027, Arbitrum price price prediction will climb even higher. As per the prediction, it will range between $3.96 and $4.60, an average of $4.10.
New technological advancements on the Ethereum blockchain could facilitate this growth, enhancing the utility and demand for ARB.
Arbitrum Price Prediction 2028
By 2028, the analysis suggests a further acceleration in ARB’s growth. As per the ARB Price Prediction, the price of Arbitrum can reach between a minimum price of $6.02 and a maximum price of $7.05, an average of $6.19.
Technological developments in the Arbitrum L2 could propel growth during this period. The market anticipates lower transaction costs and faster settlements on the Ethereum blockchain.
Arbitrum Price Prediction 2029
As per Arbitrum’s Price Prediction 2029, ARB’s price could reach a maximum and minimum price of $8.92 and $10.43, respectively, with a year-round average of $9.17.
Arbitrum DAO’s ongoing efforts to secure more global partnerships and achieve wider adoption of its token might play a pivotal role in this anticipated price rise. price of
Arbitrum Price Prediction 2030
The ARB coin price prediction for 2030 suggests a price range of $12.99 and $15.43 and an average price of $13.45. This long-term optimistic view hinges on ARB’s increasing global recognition and adoption. The demand could surge as more users and payment systems incorporate the ARB token, increasing its value.
Arbitrum Market Price Prediction: Analysts’ ARB Price Forecast
| Firm | 2024 | 2025 |
| Gov.Capital | $1.992 | $4.7408 |
| DigitalCoinPrice | $2.06 | $2.50 |
| CryptoPredictions | $1.719 | $2.077 |
- CoinCodex predicts the price of ARB could reach a high of $4.89 and a low of $1.04 by 2025.
- On YouTube, Scrembo Paul forecasts Arbitrum will close the month in green, reaching between $1.33 and $1.55.
Cryptopolitan’s Arbitrum (ARB) Price Prediction
Arbitrum has been down 25% over the last 30 days, and there are signs of dropping lower. At current levels, it remains range bound. Over the long term, ARB will move into a reversal.
It will achieve a high of $1.70 in the second half of 2024. In 2025, it will range between $1.84 and $2.25, with an average of $1.95. Note the predictions are not investment advice. Seek independent professional consultation or own research for investments.
We expect Arbitrum’s price to reach a high of $15.43 by the end of 2030.
Arbitrum Historic Price Sentiment
- The Arbitrum Foundation airdropped its token under the ticker ‘ARB’ to eligible community members on March 23. The ARB token would enable its holders to decentralized governance of the Arbitrum ecosystem.
- The airdrop granted 11.5% of the total supply to eligible users, 1.1% to DAOs operating on the Arbitrum ecosystems, and 44% to employees and Offchain Labs investors. The 44% are subject to lock-up periods and a vesting schedule. The rest is sent to the Arbitrum DAO treasury.
- According to data from Coinmarketcap, ARB started trading at $1.3240. It later crushed in September to its all-time low of $0.7453. Pre-halving and crypto spot ETFs hype helped the coins recover from October. By the end of the year, it had reached $1.4.
- The recovery proceeded into 2024; on January 12, it reached an all-time high of $2.40. Just before the Bitcoin halving in April, the coin dropped below its initial listing price.
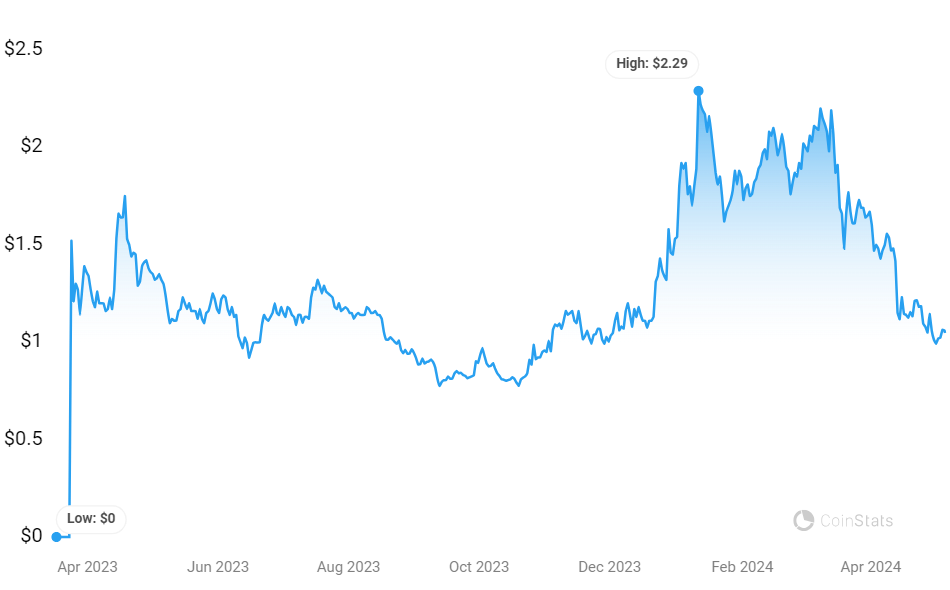
Image Source: Arbitrum Token Price, Charts & Market Insights | Your Crypto Hub
13d ago•
bullish:
0
bearish:
0
Share


 Manage all your crypto, NFT and DeFi from one place
Securely connect the portfolio you’re using to start.

bullish:
0
bearish:
0


bullish:
0
bearish:
0

bullish:
0
bearish:
0