
Aptos Price Prediction for 2024 – 2030: Will APT Token Hold Bullish Hopes?
12d ago•

bullish:
0
bearish:
0
Share
Key Takeaways
- FOMO and the Bitcoin halving hype drove APT’s bullish cycle in the first half of 2024.
- The $8 support level will persist this month.
- The APT price prediction for 2030 will range between $120.09 and $141.95, with an average price of $123.49.
Aptos is a high-performance Layer 1 blockchain with an ecosystem showing signs of maturity comprising a wide range of decentralized finance (DeFi) protocols.
Capital has aggressively moved into the blockchain, with transactions reaching $1.4 billion year-to-date, according to on-chain data compiled by OurNetwork. Part of the success was due to the Stargate Aptos campaign, which began in early March. Aptos’ total value locked (TVL) climbed over 300% over the same period. Such statistics are evidence of Aptos’ growing market value and share.
Looking ahead, Aptos continues to show promise in terms of utility, but how about the performance of APT, its native token? How high will APT go? Is APT a good investment? Let’s explore APT performance and price predictions from 2024 to 2030.
Overview
| Cryptocurrency | Aptos |
| Abbreviation | APT |
| Current Aptos Price | $8.67 |
| Market Cap | $3,712,844,472 |
| 24-Hour Trading Volume | $121,918,221 |
| Circulating Supply | 428,458,218 |
| All-time High | $19.90, on January 30 2023 |
| All-time Low | $3.09, on December 30 2022 |
| 24-Hour High | $8.81 |
| 24-Hour Low | $8.49 |
Aptos Price Prediction: Technical Analysis
| Metric | Value |
| 30-Day Variation Volatility | 14.04% |
| 50-Day SMA | $12.30 |
| 14-Day RSI | 42.30 |
| Sentiment | Bearish |
| Fear & Greed Index | 64 (Greed) |
| Green Days | 12/ 30 (40%) |
| 200-Day SMA | $9.51 |
Aptos price analysis: APT maintains crucial support
TL; DR Breakdown
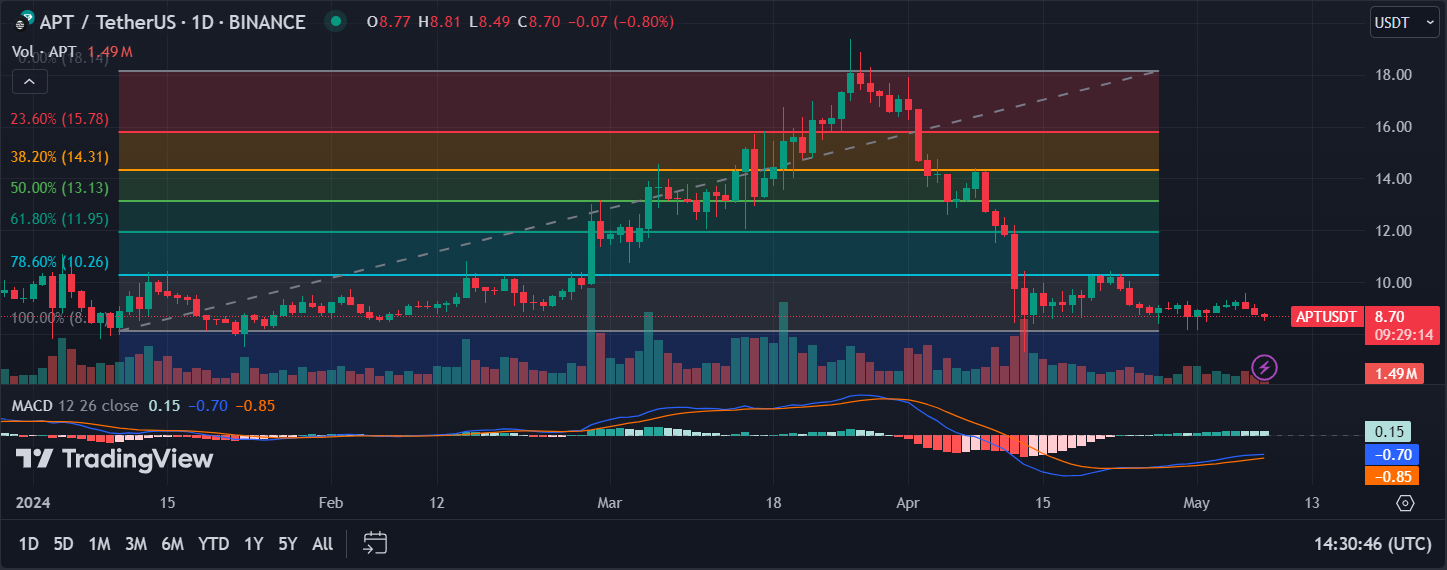
- APT rise above $19 was followed by a steep reversal to the $8 level.
- Fibonacci trendlines indicate the $8 support will persist.
Aptos price analysis 1-day chart: Aptos price falls back to support
FOMO and the Bitcoin halving hype drove APT’s bullish cycle in the first half of 2024. APT rose from the $8.16 support to a high of $19.37 towards the end of March. The rise was followed by a reversal back to the $8 level.
The RSI-14 trend line trends along the neutral level, while the Fibonacci trendlines suggest that the $8 support will persist. The next upper target is at $10.26.
APT/ USD 4-hour price chart: Bulls aim for an immediate correction
The 4-hour Bitcoin price chart suggests that bears are losing strength in their position as APT attempts to recover. The latest bullish engulfing candle could initiate a mini rally in the short term, strengthening long-position holders’ confidence.

Additionally, the MACD trend line indicates bear momentum has slowed in the last 4 hours.
Aptos Technical Indicators: Levels and Action
Daily Simple Moving Average (SMA)
| Period | Value ($) | Action |
| SMA 3 | 19.19 | SELL |
| SMA 5 | 9.20 | SELL |
| SMA 10 | 9.88 | SELL |
| SMA 21 | 10.01 | SELL |
| SMA 50 | 12.30 | SELL |
| SMA 100 | 11.48 | SELL |
| SMA 200 | 9.51 | SELL |
Daily Exponential Moving Average (EMA)
| Period | Value ($) | Action |
| EMA 3 | 9.20 | SELL |
| EMA 5 | 9.41 | SELL |
| EMA 10 | 10.26 | SELL |
| EMA 21 | 11.76 | SELL |
| EMA 50 | 12.51 | SELL |
| EMA 100 | 11.70 | SELL |
| EMA 200 | 10.33 | SELL |
What to expect from APT price analysis next?
The moving averages are bearish, advising long-position traders to close their positions. However, the daily chart indicates that APT has strong support at $8, while the 4-hour chart suggests a short reprieve for buyers in the short term.
Aptos Price Prediction May 2024
It remains unlikely that Aptos will break below the $8 support, which has held strong since the beginning of the year. However, it has a more significant upside potential. The Aptos May price prediction will range between $8.34 and $9.20. It will average at $8.90.
| Month | Potential Low ($) | Potential Average ($) | Potential High ($) |
| May | 8.34 | 8.90 | 9.20 |
Aptos Price Prediction 2024
Aptos’ supply of stablecoins has also almost doubled YTD from $50 million to $100 million. Stablecoin supply dominance as % of total TVL has declined by 13% to 27%, meaning TVL is becoming more diversified on the blockchain.
As the TVL diversifies, Aptos’ price prediction for 2024 will set the high at $13.03. However, the APT price might rest at $8.34 in a market correction, making an average of $11.80.
| Year | Potential Low ($) | Potential Average ($) | Potential High ($) |
| 2024 | 8.34 | 11.80 | 13.03 |
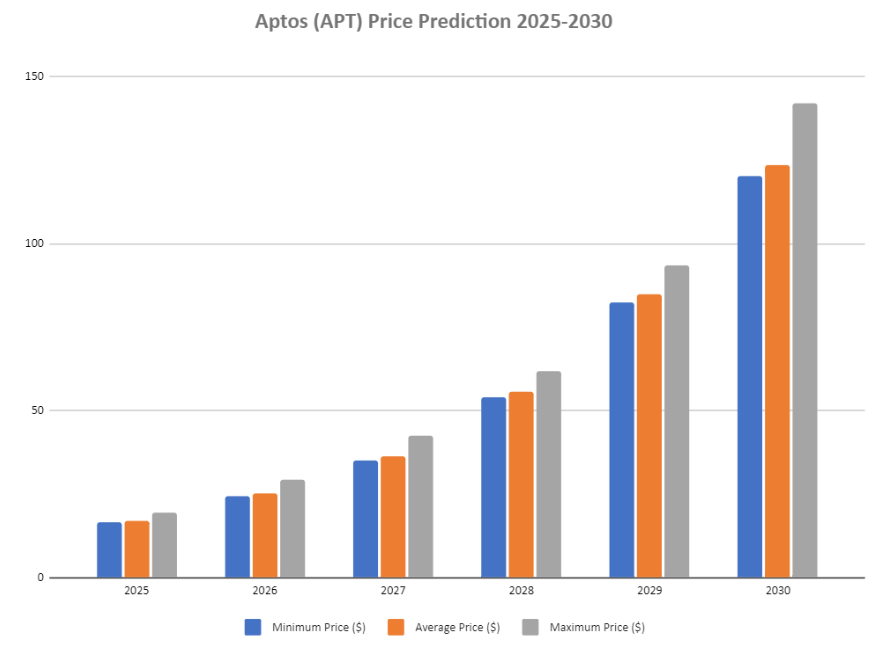
Aptos Price Prediction 2025 – 2030
| Year | Minimum Price ($) | Average price ($) | Maximum Price ($) |
| 2025 | 16.55 | 17.14 | 19.58 |
| 2026 | 24.46 | 25.15 | 29.28 |
| 2027 | 35.18 | 36.19 | 42.72 |
| 2028 | 53.92 | 55.73 | 61.83 |
| 2029 | 82.22 | 85.00 | 93.54 |
| 2030 | 120.09 | 123.49 | 141.95 |
Aptos Price Prediction 2025
The Aptos Labs community is quickly driving more utility into the Aptos ecosystem. We anticipate more growth in 2025 supported by decentralized applications such as Merkle Trade, which, months after launch, had generated over $7 billion in trading volume. Merkle Trade is the first-ever gamified perpetual decentralized exchange, blending gaming with crypto, forex, and commodities trading.
Aptos price prediction for 2025 sets the high at $19.58. However, the APT price might rest at $16.55 in a market correction, making an average of $17.14.
Aptos Price Prediction 2026
The year 2026 will experience more bullish momentum. As per the Aptos APT price prediction, it will range between $24.46 and $29.28, with an average trading price of $25.15.
The growth might result from expanding the APT community as it draws more users.
Aptos Price Prediction 2027
Moving into 2027, the Aptos price forecast will climb even higher. As per APT Price Prediction, it will range between $35.18 and $42.72, an average of $36.19.
New partnerships and developments with Aptos Labs could facilitate this growth, enhancing the utility and demand for APT.
Aptos Price Prediction 2028
By 2028, the analysis suggests a further acceleration of Aptos’s price growth. As per the APT Price Prediction, the price can reach between a minimum price of $53.92 and a maximum price of $61.83, an average of $55.73.
Technological developments in the Aptos blockchain could propel growth during this period. The market anticipates lower transaction costs and faster settlements on the blockchain, facilitating the ease of use of APT.
Aptos Price Prediction 2029
As per Aptos Price Prediction 2029, Aptos price will reach a maximum and minimum price of $93.54 and $82.22, respectively, with a year-round average of $85.00.
The Aptos Labs team, comprising researchers, builders, and designers, will drive the adoption of Aptos by creating value on the platform, potentially driving APT value higher.
Aptos Price Prediction 2030
The APT coin price prediction for 2030 suggests a price range of $120.09 to $141.95 and an average price of $123.49. The long-term bullish scenario hinges on the global adoption of the Aptos blockchain and increasing usage of the APT token to settle transaction fees.
Aptos Market Price Prediction: Analysts’ APT Price Forecast
| Firm Name | 2024 | 2025 |
| Gov.Capital | $10.377 | $29.040 |
| DigitalCoinPrice | $17.47 | $22.54 |
| CryptoPredictions.com | $13.90 | $16.25 |
- CoinCodex predicts the price of ARB could reach a high of $5.98 and a low of $1.27 by 2025.
- Bitboy Crypto predicts Aptos will rise to $183 in fair market conditions.
Cryptopolitan Aptos (APT) Price Prediction
Aptos has dropped 38% over the last 30 days, shedding most of its gains this year. Looking ahead, APT is anticipated to trade higher.
It will achieve a high of $13.03 in the second half of 2024. In 2025, it will range between $16.55 and $19.58, with an average of $17.14. Note the predictions are not investment advice. Seek independent professional consultation or do your own research.
Aptos Historic Price Sentiment
- Aptos raised seed funding in January 2022, led by a16z. Series A funding included Apollo, Dragonfly, Franklin Templeton, and others.
- Some team members behind Aptos previously built the Diem blockchain, which was deployed in early 2020 to more than a dozen node operators.
- The mainnet of Aptos was launched in October 2022; its initial total supply of APT at mainnet was 1 billion tokens.
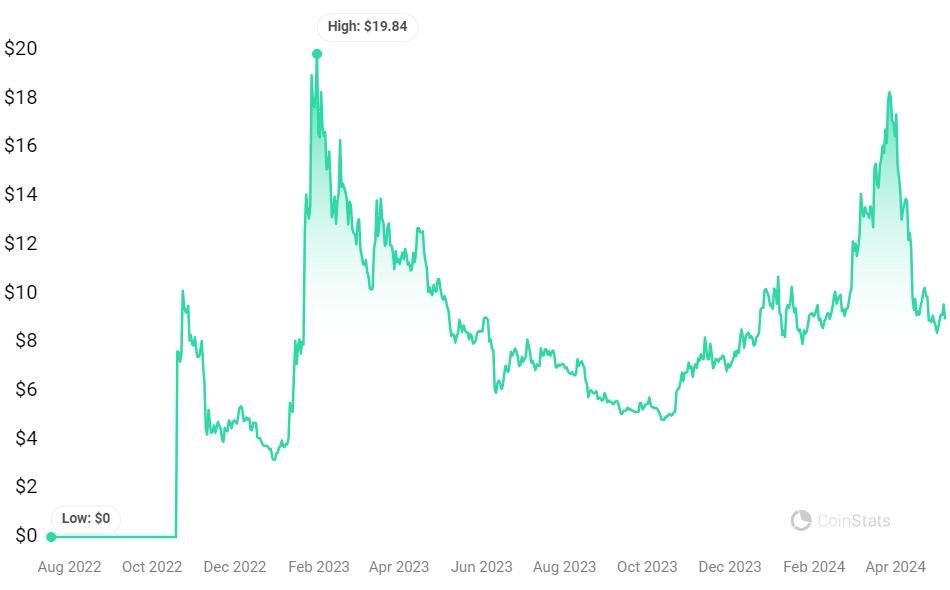
- After the initial hype, APT would fall to its lowest in December 2022 to $3.09. A month later, tables turned as it peaked at an all-time high of $19.90 on January 30, 2023.
- In January, it pumped, likely due to the blockchain’s non-fungible token market. Collections such as Aptos Monkeys and Aptomingos have attracted more users. APT was bearish in Q1 2023.
- On 6th June, APT fell below its initial listing price and extended the losses in the preceding months.
- In October, it started correcting, rising as high as $8.47 in November.
- In 2024, it broke above the $10 mark, reaching a high of $18 in March.
- From April, it reversed sharply and was traded below $10.
12d ago•
bullish:
0
bearish:
0
Share

 Manage all your crypto, NFT and DeFi from one place
Securely connect the portfolio you’re using to start.

bullish:
0
bearish:
0


bullish:
0
bearish:
0